Quick Take • AVAX trading at $13. 27 (down 3. 4% in 24h) • Granite upgrade launch failed to prevent price decline to 52-week lows • Testing critical support near $12. 57 with oversold technical readings • Following Bitcoin’s weakness amid broader risk-off sentiment in markets Market Events Driving Avalanche Price Movement The most significant development affecting AVAX price this week was the November 19 launch of the Granite upgrade, which paradoxically coincided with a 6% daily decline that pushed the token to its current 52-week low of $13. 27. The upgrade introduced dynamic blocktimes, FaceID-compatible authentication features, and optimized cross-chain messaging capabilities, yet failed to generate positive price momentum. This disconnect between fundamental development and price action reflects broader market headwinds that have overshadowed Avalanche’s technical progress. The monthly decline exceeding 25% demonstrates how macro factors are currently dominating crypto-specific catalysts. Contributing to the bearish sentiment, U. S. stock markets experienced their fourth consecutive day of losses on November 18, with the S&P 500 and Dow declining amid investor caution ahead of Nvidia’s earnings. This traditional market weakness has spilled over into cryptocurrencies, with AVAX price following the broader risk-off tone across digital assets. AVAX Technical Analysis: Oversold Conditions at Critical Support Price Action Context AVAX price currently trades significantly below all major moving averages, with the current $13. 27 level sitting 6% below the 7-day SMA at $14. 13 and a substantial 41% below the 200-day SMA at $22. 56. This positioning indicates a sustained downtrend that has accelerated in recent sessions. The Binance spot market data shows AVAX is trading near the lower Bollinger Band at $12. 86, with the %B position at 0. 0701 confirming proximity to this technical support level. Daily trading volume of $81. 8 million suggests adequate liquidity despite the declining price action. Key Technical Indicators The RSI reading of 26. 63 places Avalanche technical analysis firmly in oversold territory, typically indicating potential for a technical bounce. However, the MACD remains bearish with a -1. 7233 reading and negative histogram of -0. 0758, suggesting downward momentum persists despite oversold conditions. The Stochastic oscillator shows extreme oversold readings with %K at 11. 59 and %D at 9. 80, reinforcing the RSI signal. The Average True Range of $1. 30 indicates elevated volatility, providing both opportunity and risk for traders. Critical Price Levels for Avalanche Traders Immediate Levels (24-48 hours) • Resistance: $14. 13 (7-day moving average and previous support turned resistance) • Support: $12. 57 (24-hour low and critical technical floor) Breakout/Breakdown Scenarios A break below $12. 57 support could trigger accelerated selling toward the strong support zone at $8. 52, representing potential downside of approximately 35%. Conversely, reclaiming $14. 13 would signal initial stabilization, with the next meaningful resistance at $15. 80 (20-day SMA). AVAX Correlation Analysis Avalanche is currently exhibiting high correlation with Bitcoin’s weakness, as both assets face similar macro pressures from traditional market uncertainty. The broader cryptocurrency market’s decline has created sector-wide selling pressure that technical upgrades have been unable to offset. Traditional market correlation appears elevated, with AVAX price movements aligning with the S&P 500’s recent four-day decline. This suggests institutional and retail investors are treating crypto assets as risk assets during the current period of market caution. Trading Outlook: Avalanche Near-Term Prospects Bullish Case Oversold technical conditions could support a relief bounce if broader markets stabilize. Key catalyst would be reclaiming $14. 13 resistance and breaking above the 7-day moving average. Volume expansion above current levels would confirm institutional re-engagement with AVAX price action. Bearish Case Failure to hold $12. 57 support in the next 24-48 hours could trigger algorithmic selling and stop-loss orders, potentially driving AVAX toward single digits. Continued traditional market weakness would likely exacerbate crypto selling pressure. Risk Management Conservative traders should consider $12. 00 as a stop-loss level, representing roughly 10% downside from current levels. Given the elevated ATR of $1. 30, position sizing should account for potential daily swings exceeding 10% in either direction.
https://bitcoinethereumnews.com/tech/avax-tests-52-week-lows-at-13-27-despite-granite-upgrade-launch/
Tag: crypto-specific


Crypto recovery remains slow despite global liquidity boost: Wintermute
**Why Crypto Markets Are Not Bouncing Back Despite Favorable Macroeconomic Conditions: Insights from Wintermute**
Global liquidity is rising, stocks are soaring, and interest rates are falling — yet the cryptocurrency market continues to underperform. According to Wintermute’s latest market update dated November 3, despite a supportive macroeconomic environment, capital is not flowing into crypto markets at the same pace as other risk assets.
### Expanding Liquidity but Limited Crypto Inflows
The report highlights that global liquidity is expanding as central banks cut interest rates and wind down quantitative tightening (QT). Stock markets are sitting near all-time highs, reflecting overall positive financial conditions. However, this improvement has not translated into substantial inflows into the crypto space.
Wintermute attributes this underperformance to a redirection of liquidity. While inflows are primarily targeting equities, particularly sectors like artificial intelligence (AI) and prediction markets, crypto-specific channels have largely stalled.
### Slowdown in Key Crypto Growth Drivers
Earlier in the year, ETF inflows and Digital Asset Treasury (DAT) activities were significant drivers of crypto growth. Today, both have significantly slowed. The report notes: “The tap isn’t off, it’s just pointed somewhere else.”
The only crypto-related metric still showing growth is stablecoin supply, which has increased by over $100 billion year-to-date. In contrast, Bitcoin ETF assets under management have stagnated near $150 billion, and secondary DAT volumes have plummeted.
### Market Performance Reflects the Trends
Market data echoes this slowdown. Bitcoin (BTC) and Ethereum (ETH) have remained range-bound, with Bitcoin trading near $101,000 and Ethereum around $3,300. Meanwhile, the broader crypto market has recently experienced heavy losses, with gaming tokens, layer-2 solutions, and meme coins suffering double-digit declines over the past week.
### Wintermute Declares the Four-Year Bitcoin Cycle “Dead”
Wintermute challenges the traditional four-year Bitcoin cycle theory, arguing that it no longer holds relevance. The firm contends that in mature markets like crypto, price movements are now driven primarily by liquidity flows rather than miner supply or halving events.
This represents a fundamental shift requiring investors to adjust expectations and place greater emphasis on monitoring macroeconomic conditions and institutional behaviors.
### Crypto Market Structure Remains Healthy
Despite the current stagnation, Wintermute emphasizes that the crypto market structure remains fundamentally healthy. Leverage has been significantly reduced, volatility is subdued, and market positioning is cleaner compared to earlier in the year.
The firm remains cautiously optimistic that renewed ETF or DAT inflows could trigger the next leg of the crypto recovery. However, for now, crypto remains the weakest performer among global risk assets.
### Outlook: Recovery Hinges on Capital Inflows
Bitcoin and Ethereum ETFs have recently seen a five-day outflow streak. Until capital starts flowing back into crypto-specific instruments, a robust recovery will likely remain elusive — even in an environment characterized by abundant liquidity.
—
**In summary, while macroeconomic conditions are favorable, capital redirection and stalled inflows have kept crypto markets subdued. Investors should monitor liquidity trends closely to identify signs of a potential turnaround in this evolving landscape.**
https://bitcoinethereumnews.com/crypto/crypto-recovery-remains-slow-despite-global-liquidity-boost-wintermute/

Bitcoin Broke the Uptober Streak, but a Handful of Altcoins Managed to Finish Higher
Bitcoin closed October lower, snapping its six-year “Uptober” streak, while BNB eked out a gain as a mid-month jolt left most majors stuck below early highs.
The shock landed on October 10, when President Donald Trump threatened steep new tariffs on China amid rare-earth tensions, touching off a broad risk-off move. Bitcoin slid from roughly the low $120,000s toward about $105,000 in fast trade, and altcoins fell harder as thin liquidity met heavy leverage.
Over October 10-11, derivatives venues auto-liquidated an estimated tens of billions of dollars in positions, and more than half a trillion dollars in market value evaporated before a shaky rebound set a floor. This was a macro headline colliding with crowded positioning, not a crypto-specific catalyst.
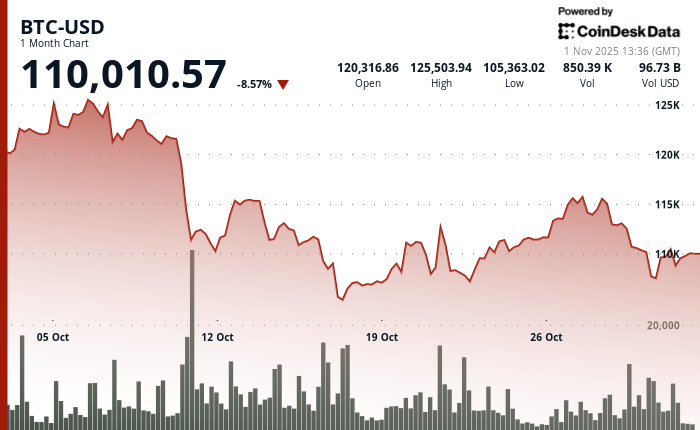
By month’s end, CoinDesk Data showed Bitcoin finishing October in the red, breaking what traders call “Uptober.” On CoinGlass’s Bitcoin Monthly Returns heat map, October 2025 is the first red October since 2018 and ends a green run that stretched from 2019 through 2024.
This lore matters because the pattern persisted across very different regimes—late-cycle surges and post-sell-off recoveries alike. So, a miss in 2025 resets expectations and reminds traders that seasonality is a tendency, not a promise.
The month’s shape was remarkably consistent across one-month TradingView charts. Bitcoin started firm, suffered the synchronized October 10-11 air pocket, then spent the back half of the month climbing without retaking its early peak.
Ether traced the same flush-base-fade arc and stalled beneath the round-number band it tested in the first week. Solana and XRP echoed that rhythm with a sequence of lower highs into the final sessions.
In practical terms, late rebounds did not flip resistance into support, which is why the monthly candles printed red for those four.
BNB broke ranks. It absorbed the mid-month downdraft, carved higher lows through the final third of the month, and closed October about 4.2% higher—leaving a green print while peers slipped.
Outside the top 10, several names also finished October up, including ZEC, XMR, and WBTC, underscoring that pockets of strength persisted beneath the surface even as leaders cooled.
Why the “Uptober” brand stuck is straightforward. It is a community nickname born from Bitcoin’s tendency to post gains in October over the past decade, reinforced by that CoinGlass grid showing every October from 2019 through 2024 in the green.
Flipping the cell to red this year does not erase the historical tilt, but it does nudge risk management back to tape confirmation rather than calendar confidence.
The numbers that different dashboards show can diverge for mundane reasons. CoinGlass presents calendar-month, close-to-close results that isolate October. Rolling 30-day readings on major trackers update continuously and often include early-October highs, so they can show a steeper decline into November 1 even when the strict calendar month looks milder.
The direction is the same; the measurement window drives the magnitude.
https://bitcoinethereumnews.com/bitcoin/bitcoin-broke-the-uptober-streak-but-a-handful-of-altcoins-managed-to-finish-higher/?utm_source=rss&utm_medium=rss&utm_campaign=bitcoin-broke-the-uptober-streak-but-a-handful-of-altcoins-managed-to-finish-higher