
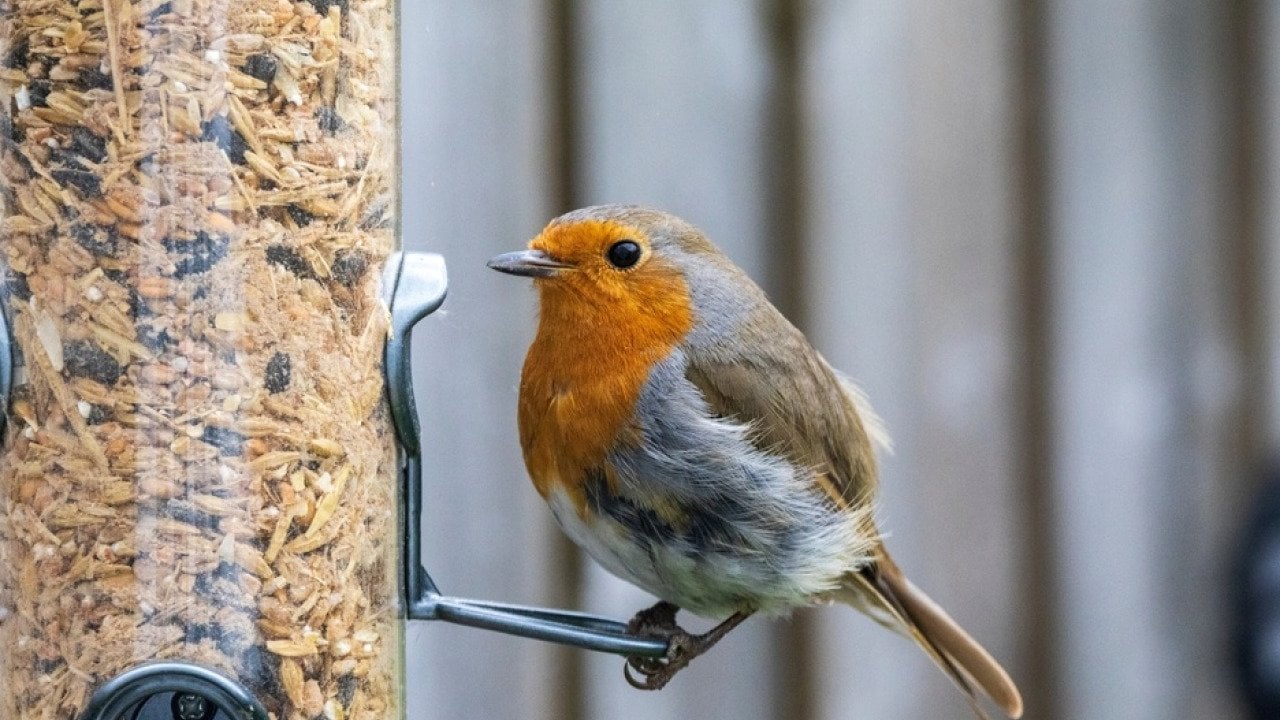
RJM Behind the Lens // Shutterstock Stacker compiled a list of the most common birds seen near feeders in Missouri using data from the Cornell Lab of Ornithology’s Project FeederWatch. Birds are ranked by the percent of sites visited from Nov. 8 to Nov. 21. Ties are broken by the average group size when seen, any further ties were not broken. Data was collected at 169 count sites in Missouri. States with less than 10 count sites were not included in rankings for each bird. Project FeederWatch, a citizen science project where participants collect data on birds at their feeders, was founded in Ontario by Erica Dunn and the Long Point Bird Observatory in 1976. The project partnered with the Cornell Lab of Ornithology after 10 years to scale the project across the U. S. and Canada and now has over 20, 000 participants. The data Project FeederWatch collects is used by scientists to understand trends in bird populations. If you would like to participate as a FeederWatcher you can learn more about the project here. Read on to see which birds are most commonly seen in your state. #1. Northern Cardinal Sites visited Nov. 8 to Nov. 21: 83% Average group size: 2. 55 States with the highest percent of sites visited #1. Kentucky: 93% #2. Mississippi: 91% #3. Alabama: 89% #4. Arkansas: 88% #5. Tennessee: 84% #2. Dark-eyed Junco Sites visited Nov. 8 to Nov. 21: 77% Average group size: 2. 75 States with the highest percent of sites visited #1. Washington: 93% #1. Oregon: 93% #3. Connecticut: 86% #4. New Jersey: 85% #5. New York: 84% #3. House Finch Sites visited Nov. 8 to Nov. 21: 73% Average group size: 3. 04 States with the highest percent of sites visited #1. New Mexico: 87% #2. Arizona: 85% #3. Colorado: 84% #4. West Virginia: 83% #5. Indiana: 81% #4. Downy Woodpecker Sites visited Nov. 8 to Nov. 21: 70% Average group size: 1. 38 States with the highest percent of sites visited #1. Connecticut: 87% #2. Massachusetts: 85% #3. Rhode Island: 79% #3. New Hampshire: 79% #5. Wisconsin: 78% #5. Mourning Dove Sites visited Nov. 8 to Nov. 21: 65% Average group size: 3. 37 States with the highest percent of sites visited #1. Rhode Island: 81% #2. Connecticut: 80% #3. Massachusetts: 79% #4. New Jersey: 78% #5. New York: 75% #6. American Goldfinch Sites visited Nov. 8 to Nov. 21: 60% Average group size: 3. 19 States with the highest percent of sites visited #1. Wisconsin: 73% #1. Michigan: 73% #3. West Virginia: 72% #4. Minnesota: 66% #4. Maine: 66% #7. Tufted Titmouse Sites visited Nov. 8 to Nov. 21: 59% Average group size: 1. 86 States with the highest percent of sites visited #1. Connecticut: 95% #2. Massachusetts: 87% #3. New Hampshire: 85% #3. Maine: 85% #5. Rhode Island: 84% #8. House Sparrow Sites visited Nov. 8 to Nov. 21: 57% Average group size: 4. 76 States with the highest percent of sites visited #1. Illinois: 85% #2. Iowa: 84% #3. Nebraska: 81% #4. Ohio: 75% #5. Indiana: 74% #9. Blue Jay Sites visited Nov. 8 to Nov. 21: 55% Average group size: 1. 6 States with the highest percent of sites visited #1. Massachusetts: 92% #2. Connecticut: 91% #2. Rhode Island: 91% #4. New Hampshire: 90% #5. Vermont: 88% #10. White-breasted Nuthatch Sites visited Nov. 8 to Nov. 21: 51% Average group size: 1. 3 States with the highest percent of sites visited #1. New Hampshire: 83% #1. Maine: 83% #1. Massachusetts: 83% #4. Connecticut: 82% #5. Vermont: 76% #11. Red-bellied Woodpecker Sites visited Nov. 8 to Nov. 21: 43% Average group size: 1. 11 States with the highest percent of sites visited #1. Connecticut: 87% #2. Rhode Island: 70% #2. Indiana: 70% #4. Massachusetts: 69% #5. Michigan: 67% #12. American Robin Sites visited Nov. 8 to Nov. 21: 41% Average group size: 3. 0 States with the highest percent of sites visited #1. New Mexico: 46% #2. Nevada: 43% #3. Missouri: 41% #3. Colorado: 41% #5. Kansas: 40% #13. Carolina Wren Sites visited Nov. 8 to Nov. 21: 40% Average group size: 1. 18 States with the highest percent of sites visited #1. Mississippi: 91% #2. Georgia: 71% #3. North Carolina: 70% #4. Alabama: 68% #5. Virginia: 66% #14. White-throated Sparrow Sites visited Nov. 8 to Nov. 21: 37% Average group size: 2. 11 States with the highest percent of sites visited #1. Mississippi: 64% #2. Connecticut: 59% #3. New Jersey: 58% #4. Arkansas: 56% #5. Alabama: 55% #15. Eurasian Tree Sparrow Sites visited Nov. 8 to Nov. 21: 30% Average group size: 4. 56 States with the highest percent of sites visited #1. Missouri: 30% #2. Iowa: 8% #3. Illinois: 5% #16. European Starling Sites visited Nov. 8 to Nov. 21: 30% Average group size: 2. 69 States with the highest percent of sites visited #1. Nebraska: 34% #2. Missouri: 30% #3. South Dakota: 28% #3. Indiana: 28% #5. Wyoming: 24% #17. Eastern Bluebird Sites visited Nov. 8 to Nov. 21: 30% Average group size: 2. 01 States with the highest percent of sites visited #1. Georgia: 50% #2. South Carolina: 45% #3. North Carolina: 43% #4. Tennessee: 36% #5. Arkansas: 35% #18. Black-capped Chickadee Sites visited Nov. 8 to Nov. 21: 30% Average group size: 1. 9 States with the highest percent of sites visited #1. New Hampshire: 96% #1. Maine: 96% #3. Vermont: 95% #4. Minnesota: 90% #5. Massachusetts: 89% #19. Carolina/Black-capped Chickadee Sites visited Nov. 8 to Nov. 21: 28% Average group size: 2. 05 States with the highest percent of sites visited #1. Missouri: 28% #2. Pennsylvania: 27% #3. West Virginia: 25% #4. Indiana: 24% #5. Ohio: 22%.
https://www.newspressnow.com/stacker-missouri/2025/11/26/most-commonly-seen-birds-in-missouri/
Tag: data


New Diginomica Network Research Uncovers CIOs’ Struggle with Bridging the AI Hype and Reality
New Research Reveals Challenges in Enterprise AI Adoption
London, November 17, 2025 – New research from the diginomica network uncovers the challenges enterprise organizations face in adopting artificial intelligence (AI). Based on in-depth discussions with 35 CIOs and CTOs from major global companies, the report highlights a significant disconnect between expectations and reality regarding AI’s return on investment.
According to the research, 93% of diginomica network members have implemented AI within their organizations. Use cases range from website chatbots and predictive algorithms to drug discovery. Despite this widespread adoption, however, high-profile AI implementations—such as Microsoft Copilot and automated bid tools—have failed to meet the elevated expectations set by boards and executive teams.
Key Findings
- Over three-quarters of organizations report AI success rates exceeding 50%.
- Technology leaders consistently emphasize that AI has not met the expectations placed upon it by boards and executives, making it difficult for CIOs to manage stakeholder expectations and maintain trust.
- Data quality and change management, rather than technology itself, are the primary barriers to realizing AI’s full potential.
- Poor adoption strategies are causing organizations to capture as little as 10% of potential AI benefits.
Ian Cohen, a seasoned CIO with leadership experience at Lloyds, the Financial Times, and Addison Lee, stresses the need for CIOs to manage the growing hype around AI. He explains, “It is our job to temper that enthusiasm with a healthy dose of reality.”
Barriers to Successful AI Adoption
The report identifies several critical challenges hindering AI success:
- Poor data quality
- Insufficient change management
- Legacy system constraints
- Fundamental misunderstandings of AI capabilities across the C-suite
Confusion around different AI technologies—including agentic AI, generative AI, and robotics—is also highlighted in the research.
The study emphasizes the importance of implementing proper change management strategies and warns against treating this aspect as an afterthought. Without effective adoption strategies, organizations risk repeating the failures of previous technology implementations.
Cohen adds, “We risk the same happening with AI if we do not properly drive education and adoption.”
About the Research and diginomica Network
Mark Chillingworth, author of the research and facilitator of the diginomica network, thanks the participating CIOs and CTOs for sharing their experiences and valuable insights.
The full report, “CIOs navigate AI’s weight of expectation and explore opportunities,” is available for download here.
About diginomica
diginomica is an independent media and analyst organization serving enterprise leaders in the digital era. With experienced writers and analysts based in the US and Europe, diginomica delivers authoritative reporting and analysis that cuts through the noise.
Unlike traditional advertising-driven media, diginomica prioritizes reader quality, engagement, and influence. The organization provides rich insights based on daily interactions with both technology buyers and vendors. diginomica is also committed to the responsible use of generative AI in journalism, focusing on reader experience, accessibility, and trust.
About the diginomica Network
The diginomica network is an invitation-only forum comprising more than 400 CIOs and CTOs from leading global organizations. It provides a trusted space for technology leaders to confidentially discuss strategic technology challenges.
Free from vendor influence, the network fosters peer-to-peer learning and collaboration among enterprise technology leadership.
ENDS.


Vertex Pharmaceuticals Incorporated (VRTX) Discusses Updated Data for Pove in IgAN and pMN and Developments in Kidney Disease Portfolio – Slideshow
**Vertex Pharmaceuticals Incorporated (VRTX) Q3 2025 Earnings Summary**
Vertex Pharmaceuticals Incorporated recently reported its Q3 2025 earnings, showcasing strong financial performance. The company reported an earnings per share (EPS) of $4.80, surpassing analysts’ expectations by $0.22. Revenue for the quarter reached $3.08 billion, representing a 10.99% year-over-year increase and beating estimates by $17.21 million.
In conjunction with this announcement, Vertex Pharmaceuticals published a detailed slide deck to provide further insights into the company’s performance and future outlook.
This article was prepared by Seeking Alpha’s Transcripts team, which is responsible for creating and managing all transcript-related content on our platform. Currently, we publish thousands of quarterly earnings calls each quarter and are continuously expanding our coverage to keep readers informed with the latest corporate developments.
Thank you for reading.
— The SA Transcripts Team
**Comments**
[Section for user comments]
**Recommended For You**
[Section for related articles and recommendations]
https://seekingalpha.com/article/4840989-vertex-pharmaceuticals-incorporated-vrtx-discusses-updated-data-for-pove-in-igan-and-pmn-and?source=feed_all_articles