Ethereum joins Bitcoin in recording third-largest weekly ETF outflow at $508M

Key Takeaways:
Ethereum recorded $508 million in net outflows this week, marking the third-largest weekly redemption since the launch of its spot ETF. During the same period, Bitcoin ETFs also experienced significant investor withdrawals.

Ethereum’s weekly ETF outflow highlights a substantial movement of capital from spot Ethereum ETFs—regulated investment funds that directly track the price of Ethereum. Bitcoin ETFs, which hold the foundational cryptocurrency, faced similar investor withdrawals, indicating a broader trend across major digital asset funds.

Analysts suggest that these ETF outflows for both Ethereum and Bitcoin point to short-term institutional caution amid growing market uncertainty. The withdrawals may reflect a temporary risk-off sentiment among larger investors in the cryptocurrency space, as they reevaluate their exposure to volatile assets.

The parallel outflows from both Ethereum and Bitcoin ETFs emphasize how institutional investors are actively adjusting their holdings in major digital assets. Some experts interpret this trend as profit-taking, following previous periods of strong capital inflows into these regulated investment vehicles.

Overall, these developments underscore an evolving dynamic within crypto markets, driven by institutional sentiment and ongoing market fluctuations.
https://cryptobriefing.com/ethereum-bitcoin-third-largest-etf-outflow-507-million/

MATIC Price Prediction: Target $0.45-$0.52 Range Within 30 Days Despite Current Bearish Momentum

**MATIC Price Prediction Summary**

– **Short-term target (1 week):** $0.42 (+10.5%), reaching EMA 26 resistance
– **Medium-term forecast (1 month):** $0.45–$0.52 range, testing SMA 20 to upper Bollinger Band
– **Key level for bullish continuation:** $0.58 (strong resistance confluence)
– **Critical support if bearish:** $0.35 (immediate support) and $0.33 (strong support floor)

### Recent Polygon Price Predictions from Analysts

The current market environment shows a notable absence of fresh analyst predictions for MATIC over the past three days. This suggests either a consolidation in sentiment or analysts waiting for clearer directional signals. Such silence often precedes significant moves in cryptocurrency markets, as technical patterns develop without fundamental news interference.

The lack of recent predictions contrasts with MATIC’s current technical setup, which presents clear levels for both bullish and bearish scenarios. This creates an opportunity for independent technical analysis to guide our Polygon forecast without the noise of conflicting analyst opinions.

### MATIC Technical Analysis: Setting Up for Potential Reversal

Polygon’s technical indicators show a cryptocurrency approaching oversold territory with several converging factors that could trigger a reversal.

– The current RSI reading of **38.00** sits in neutral territory but is trending toward oversold conditions—historically a precursor to bounces in MATIC.
– The MACD histogram at **–0.0045** indicates bearish momentum, but its relatively small magnitude suggests the selling pressure may be waning.
– MATIC’s position at **$0.29** within the Bollinger Bands places it much closer to the lower band ($0.31) than the upper band ($0.56), indicating potential for a mean reversion toward the middle band at $0.43.
– Current trading volume of approximately $1,074,371 on Binance reflects moderate market participation, neither confirming strong selling pressure nor indicating accumulation.
– The narrow 24-hour trading range suggests consolidation, which often precedes directional moves once key levels break.

### Polygon Price Targets: Bull and Bear Scenarios

#### Bullish Case for MATIC

In a bullish scenario, MATIC’s primary price target sits between **$0.45 and $0.52** over the next 30 days. This range encompasses the SMA 20 ($0.43) and approaches the upper Bollinger Band, representing an 18% to 37% upside from current levels.

For this bullish thesis to materialize:
– MATIC must reclaim the EMA 26 at **$0.42**, signaling a short-term momentum shift.
– A break above **$0.45** (SMA 50) would confirm medium-term strength and could target the strong resistance at **$0.58**.

The technical setup supports this outlook as MATIC currently trades significantly below all major moving averages, offering substantial room for mean reversion.

Additional bullish indicators include a Stochastic oscillator reading of **25.19% (%K)**, suggesting oversold conditions that often precede price bounces.

#### Bearish Risk for Polygon

Conversely, a break below immediate support at **$0.35** would invalidate the bullish scenario and target the strong support floor at **$0.33**, near the 52-week low region ($0.37) and a critical psychological level for MATIC holders.

A sustained drop below $0.33 could trigger accelerated selling toward **$0.28–$0.30**, representing a 20% to 26% decline from current levels.

The ongoing bearish momentum, as indicated by the negative MACD histogram, reinforces this downside risk if support levels fail to hold.

### Should You Buy MATIC Now? Entry Strategy

Based on the current technical analysis, a staged entry approach is recommended:

– Consider initiating positions near current levels (approximately **$0.38**) with a stop-loss set just below **$0.34** to limit downside risk to around 10%.
– For more aggressive traders, waiting for a confirmed break above **$0.42** (EMA 26) coupled with increased trading volume could signal a momentum shift and offer a better risk-reward profile.

Position sizing should remain conservative due to the bearish MACD reading and proximity to support levels. Risk no more than 2–3% of your portfolio until MATIC demonstrates sustained movement above $0.45.

Ultimately, whether to buy or sell MATIC depends on your risk tolerance. Conservative investors might wait for clear bullish confirmation above $0.42, while contrarian traders could consider small positions at current oversold levels.

### MATIC Price Prediction Conclusion

Our price prediction anticipates a recovery to the **$0.45–$0.52** range within 30 days. This outlook carries moderate confidence (6/10), based on technical indicators and the historical tendency for mean reversion when an asset trades significantly below its moving averages alongside oversold momentum signals.

Key levels to monitor include:
– Immediate resistance at **$0.42** (EMA 26) for bullish confirmation
– Support at **$0.35** for bearish invalidation

The prediction timeline extends through early December 2025, with interim targets of **$0.42** within 1 week and **$0.45** within 2–3 weeks.

Success depends on MATIC holding above $0.35 and showing increased buying interest as it approaches oversold territory. Failure below this level would shift focus to downside targets near $0.33 and possibly lower.

*Stay updated with the latest Polygon (MATIC) price movements and technical analysis to make informed trading decisions.*
https://bitcoinethereumnews.com/tech/matic-price-prediction-target-0-45-0-52-range-within-30-days-despite-current-bearish-momentum/

Canada Follows U.S. in Regulating Stablecoins in Budget

**Canada to Establish New Stablecoin Laws, Mirroring the U.S. GENIUS Act**

Stablecoins are gaining worldwide attention for their ease of use in payment transactions. In response, Canada is on track to introduce new regulations for stablecoins, aligning its approach with recent legislative developments in the United States.

### Canada Moves Forward with Stablecoin Regulations

As disclosed in the Canadian government’s 2025 budget released on Tuesday, November 4, 2025, stablecoin issuers will soon need to meet specific criteria under proposed federal legislation. These requirements include holding sufficient reserves and establishing clear redemption policies. Additionally, issuers must implement robust risk management frameworks designed to protect personal and financial data.

Starting in the 2026-2027 fiscal year, the Bank of Canada will allocate $10 million over two years to oversee a smooth regulatory rollout. Following this initial phase, stablecoin issuers are expected to cover an estimated $5 million annually in regulatory costs. These rules will come under the ambit of the Retail Payment Activities Act.

The government’s primary goal is to deliver faster, cheaper, and safer digital transactions to benefit Canada’s 41.7 million residents. This effort also forms part of a broader initiative to modernize the country’s entire payment system.

### No Central Bank Digital Currency for Now

Currently, Canada does not have a Central Bank Digital Currency (CBDC). The country canceled its digital loonie project in September 2024, with Bank of Canada Governor Tiff Macklem stating, “No strong case yet.” Since then, Canada has shifted focus from developing a digital currency toward modernizing its domestic payment infrastructure.

### Canada’s Stance Amid Market Movements

In an unexpected move, the National Bank of Canada adopted a bearish stance towards Bitcoin. The bank filed documents with the U.S. Securities and Exchange Commission (SEC) to exercise a put option on its BlackRock iShares Bitcoin Trust ETF holdings, valued at more than $1.3 million.

Despite this cautious approach towards cryptocurrencies, Canada is eager not to lag behind in regulatory frameworks and global competition. The move to establish clear stablecoin laws follows the United States’ passage of the GENIUS Act in July 2025, signaling a growing emphasis on regulating digital assets.

### Stablecoin Market Expansion

The introduction of regulatory frameworks in both the U.S. and Canadian markets comes amid rapid expansion in the stablecoin sector. Currently, the stablecoin market sits at approximately $309.1 billion. The U.S. Treasury estimated in April 2025 that this figure could surge to $2 trillion by 2028.

Stablecoins have already become dominant in several markets. For example, in Latin America, Tether (USDT) and USDC stablecoins hold a leading position. In Argentina, stablecoins make up 72% of all cryptocurrency purchases in 2024, far surpassing Bitcoin, which accounts for only 8%.

### Innovation in Stablecoin Payments

Partnerships are accelerating the adoption of stablecoin payments worldwide. Recently, DeCard partnered with Polygon Labs to enable stablecoin payments across over 150 million merchants globally. This platform allows users to convert popular cryptocurrencies like USDT and USDC into traditional fiat currencies, which can be spent anywhere cards are accepted.

In Canada, payment platforms such as Tetra Digital are emerging as key players in the stablecoin space. Tetra Digital has raised $10 million to create a digital version of the Canadian dollar, backed by investments from major firms including Shopify, Wealthsimple, and the National Bank of Canada.

Canada’s regulatory efforts and market innovations indicate a significant step toward integrating stablecoins into mainstream finance, ensuring secure and efficient digital payment options for Canadians.
https://bitcoinethereumnews.com/tech/canada-follows-u-s-in-regulating-stablecoins-in-budget/

Crypto recovery remains slow despite global liquidity boost: Wintermute

**Why Crypto Markets Are Not Bouncing Back Despite Favorable Macroeconomic Conditions: Insights from Wintermute**

Global liquidity is rising, stocks are soaring, and interest rates are falling — yet the cryptocurrency market continues to underperform. According to Wintermute’s latest market update dated November 3, despite a supportive macroeconomic environment, capital is not flowing into crypto markets at the same pace as other risk assets.

### Expanding Liquidity but Limited Crypto Inflows

The report highlights that global liquidity is expanding as central banks cut interest rates and wind down quantitative tightening (QT). Stock markets are sitting near all-time highs, reflecting overall positive financial conditions. However, this improvement has not translated into substantial inflows into the crypto space.

Wintermute attributes this underperformance to a redirection of liquidity. While inflows are primarily targeting equities, particularly sectors like artificial intelligence (AI) and prediction markets, crypto-specific channels have largely stalled.

### Slowdown in Key Crypto Growth Drivers

Earlier in the year, ETF inflows and Digital Asset Treasury (DAT) activities were significant drivers of crypto growth. Today, both have significantly slowed. The report notes: “The tap isn’t off, it’s just pointed somewhere else.”

The only crypto-related metric still showing growth is stablecoin supply, which has increased by over $100 billion year-to-date. In contrast, Bitcoin ETF assets under management have stagnated near $150 billion, and secondary DAT volumes have plummeted.

### Market Performance Reflects the Trends

Market data echoes this slowdown. Bitcoin (BTC) and Ethereum (ETH) have remained range-bound, with Bitcoin trading near $101,000 and Ethereum around $3,300. Meanwhile, the broader crypto market has recently experienced heavy losses, with gaming tokens, layer-2 solutions, and meme coins suffering double-digit declines over the past week.

### Wintermute Declares the Four-Year Bitcoin Cycle “Dead”

Wintermute challenges the traditional four-year Bitcoin cycle theory, arguing that it no longer holds relevance. The firm contends that in mature markets like crypto, price movements are now driven primarily by liquidity flows rather than miner supply or halving events.

This represents a fundamental shift requiring investors to adjust expectations and place greater emphasis on monitoring macroeconomic conditions and institutional behaviors.

### Crypto Market Structure Remains Healthy

Despite the current stagnation, Wintermute emphasizes that the crypto market structure remains fundamentally healthy. Leverage has been significantly reduced, volatility is subdued, and market positioning is cleaner compared to earlier in the year.

The firm remains cautiously optimistic that renewed ETF or DAT inflows could trigger the next leg of the crypto recovery. However, for now, crypto remains the weakest performer among global risk assets.

### Outlook: Recovery Hinges on Capital Inflows

Bitcoin and Ethereum ETFs have recently seen a five-day outflow streak. Until capital starts flowing back into crypto-specific instruments, a robust recovery will likely remain elusive — even in an environment characterized by abundant liquidity.

**In summary, while macroeconomic conditions are favorable, capital redirection and stalled inflows have kept crypto markets subdued. Investors should monitor liquidity trends closely to identify signs of a potential turnaround in this evolving landscape.**
https://bitcoinethereumnews.com/crypto/crypto-recovery-remains-slow-despite-global-liquidity-boost-wintermute/

CoinDesk 20 Performance Update: SUI Gains 9.6%, Leading Index Higher

Avalanche and AVAX (+9.0%) showed strong performance, while laggards included ICP (-18.1%) and BTC (+2.4%). The CoinDesk 20 is a broad-based index traded on multiple platforms across several regions globally.

### Inside Zcash: Encrypted Money at Planetary Scale
*By CoinDesk Research | Nov 3, 2025*
*Commissioned by Gen Zcash*

Zcash has undergone a significant transformation in 2025, evolving from niche privacy technology into a fully functioning encrypted-money network. This evolution is marked by substantial growth in shielded adoption and a shift towards privacy becoming standard practice.

Currently, between 20-25% of circulating ZEC is held in encrypted addresses, while 30% of all transactions involve the shielded pool. This increase in privacy usage is largely attributed to the Zashi wallet, which has made shielded transfers the default option, pushing privacy from being optional to a standard feature.

Additionally, Project Tachyon, led by Sean Bowe, is underway to amplify transaction throughput to thousands of private transactions per second, further enhancing Zcash’s scalability and usability.

Zcash’s advancements have recently led it to surpass Monero in market share, establishing it as the largest privacy-focused cryptocurrency by capitalization.

Stay tuned for more updates as Zcash continues to develop its zero-knowledge architecture and expand its encrypted transaction ecosystem.
https://www.coindesk.com/coindesk-indices/2025/11/05/coindesk-20-performance-update-sui-gains-9-6-leading-index-higher

BNB Tests Lower Bollinger Band at $943 as Bearish Momentum Builds Despite Long-Term Uptrend

**Binance Coin (BNB) Price Analysis: Testing Support as Bearish Momentum Builds**

**Quick Take**

– **Price**: $942.86 (down 1.3% in 24h)
– **Technical**: Testing lower Bollinger Band support with bearish signals
– **RSI**: 33.68, suggesting oversold conditions
– **Market Context**: Reflects broader crypto weakness as Bitcoin declines

### Market Events Driving Binance Coin Price Movement

Binance Coin is currently trading lower, with no major news events directly impacting BNB in the past 48 hours. The price decline mainly follows the broader cryptocurrency market’s downturn, led by weakness in Bitcoin. This is in line with typical correlations during periods of technical consolidation, where altcoins often follow Bitcoin’s direction.

Despite the recent pullback, Binance spot market volume remains robust at $893.7 million. This indicates sustained institutional interest and suggests the current drop is likely a temporary correction rather than a shift in long-term sentiment.

### Binance Coin Technical Analysis: Oversold Bounce Setup

#### Price Action Context

BNB price is trading well below all short and medium-term moving averages:

– **7-day SMA**: $1,031.26
– **20-day SMA**: $1,078.10
– **50-day SMA**: $1,092.16

However, BNB remains above the **critical 200-day moving average** at $815.31—preserving its long-term bullish structure. The current price has slipped outside the lower Bollinger Band (-0.1087 %B reading), historically a sign that a short-term bounce may be forming.

#### Key Technical Indicators

– **RSI (33.68)**: In neutral-to-oversold territory, approaching levels that have marked local bottoms in the past.
– **MACD Histogram (-21.57)**: Confirms ongoing bearish momentum, but such an extreme reading suggests possible exhaustion ahead.
– **Stochastic Oscillator (%K: 20.54, %D: 18.03)**: Deep in oversold territory, often associated with imminent reversal attempts when combined with support level tests.

### Critical Price Levels for Binance Coin Traders

**Immediate Levels (24–48 hours):**
– **Resistance:** $967.02 (Lower Bollinger Band, now acting as resistance)
– **Support:** $880.80 (24-hour low and key support zone)

**Breakout/Breakdown Scenarios**

– A break **below $880.80 support** could trigger further selling, with the next strong support at $860.11 testing buyers’ commitment.
– Conversely, reclaiming the **$967** lower Bollinger Band level would signal the start of a mean reversion move, potentially targeting the 20-day MA near $1,078.

### BNB Correlation Analysis

– **Bitcoin**: BNB is closely tracking Bitcoin, with a 0.8–0.9 correlation during risk-off periods.
– **Traditional Markets**: Little direct correlation to S&P 500 movements in the current session.
– **Sector Peers**: BNB is underperforming compared to some exchange tokens, mainly due to BNB-specific technical pressures.

### Trading Outlook: Binance Coin Near-Term Prospects

**Bullish Case**
– If BNB holds the $880.80 support and shows RSI divergence, a relief rally toward the $1,000–$1,030 resistance area is plausible.
– Historical behavior after closing outside the lower Bollinger Band often results in mean reversion over 3–7 days.

**Bearish Case**
– Failure to hold the $880.80 support could open downside risk toward $860.11, and perhaps even the 200-day MA at $815 if crypto market weakness intensifies.
– Negative MACD momentum suggests limited buying interest at current levels.

### Risk Management

– **Stop-loss recommendation:** Below $860 for long positions.
– **Position sizing:** Recommended at 2–3% due to the elevated ATR ($70.42) and ongoing volatility. This helps manage risk during uncertain technical conditions.

*Image source: Shutterstock.*
https://Blockchain.News/news/20251105-bnb-tests-lower-bollinger-band-at-943-as-bearish-momentum

XRP Whale Sell-Off Signals Potential Downside Near $2.2 Support Zone

**XRP Whales Offload 900,000 Tokens in Five Days, Fueling Bearish Market Sentiment**

XRP whales have recently intensified selling pressure by offloading approximately 900,000 tokens over the past five days. This significant sell-off has coincided with weakening on-chain metrics and technical indicators, driving a bearish sentiment in the market and pushing prices toward critical support levels between $2.20 and $2.30.

At the same time, Open Interest has dropped 15.73% to $3.52 billion, signaling reduced leverage and heightened risk aversion among traders. Liquidation heatmaps reveal dense clusters at $2.20 and $2.30, highlighting key volatility triggers with over $100 million in potential liquidations.

### What Is Driving the Recent XRP Whale Selling Pressure?

Large investors, or whales, have become the dominant force behind the recent XRP sell-off, distributing around 900,000 tokens in just five days. This surge in selling activity reflects growing caution among market participants amid broader volatility.

The sell-off aligns with a 12% decrease in large holder accumulation over the past week, according to on-chain data from Santiment. Together with technical weaknesses, this selling pressure underscores a market environment marked by caution and increased short-term bearish risks.

### How Are Technical Indicators Reflecting XRP’s Current Market Position?

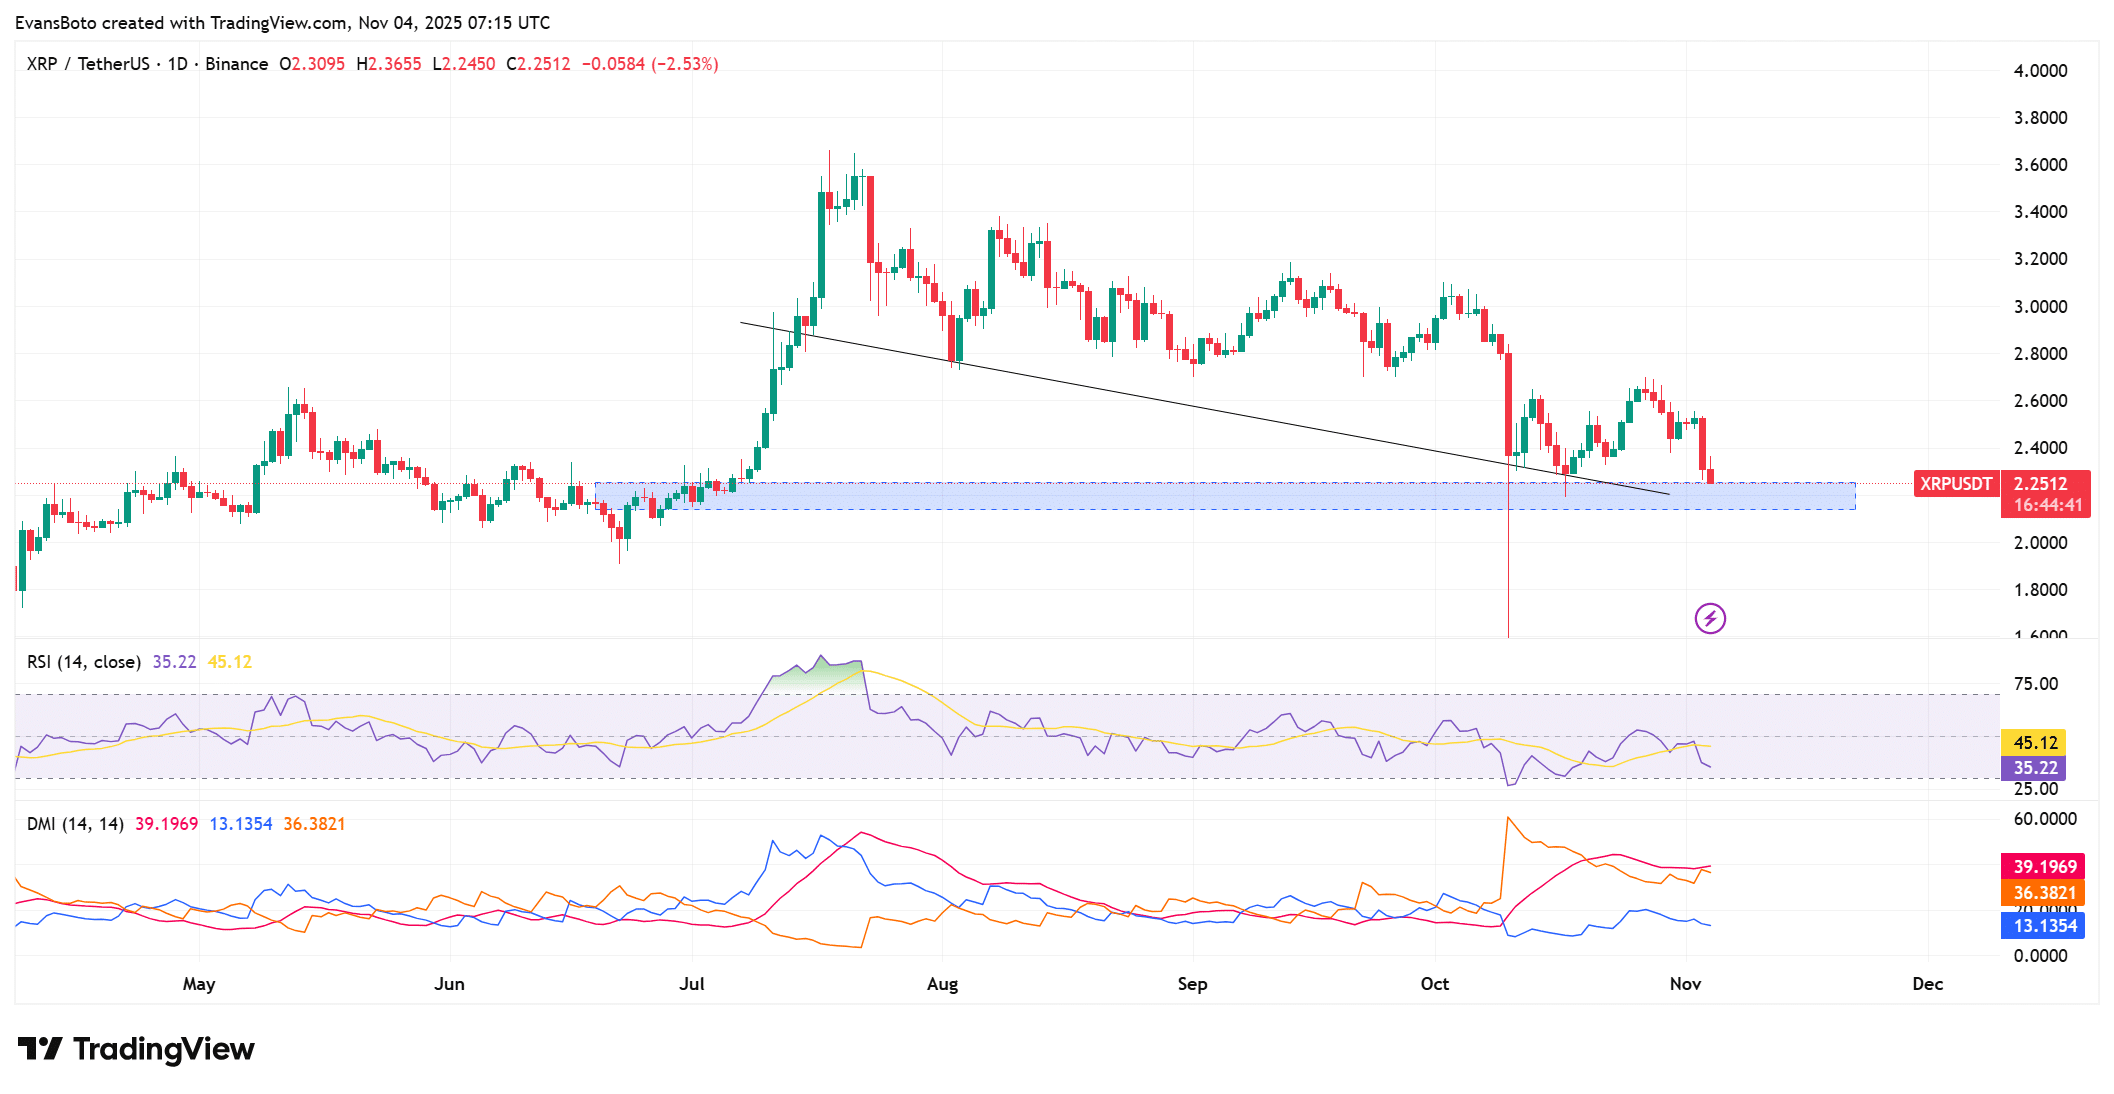
Technical analysis shows a clear bearish tilt in XRP’s price action:

– **Relative Strength Index (RSI):** Currently at 35.22, approaching oversold territory, suggesting the possibility of buying interest emerging soon.
– **Directional Movement Index (DMI):** The negative directional indicator (-DI) stands at 36.38, overpowering the positive directional indicator (+DI) of 13.13.
– **Average Directional Index (ADX):** At 39.19, confirming strong downward trend momentum.

Price action has formed lower highs and repeatedly faces rejection by a descending resistance trendline, limiting any upward breakout attempts. XRP is consolidating within the $2.20–$2.30 demand zone, a historically significant area known for accumulation and potential price rebounds.

### Open Interest and Derivatives Market Contraction

The derivatives market for XRP has seen a notable pullback, with Open Interest falling by 15.73% to $3.52 billion. This decline reflects a broad reduction in trader participation, typically associated with periods of uncertainty and risk aversion.

According to Coinglass data, such retrenchment in leverage often leads to more stable price movements but also points to diminished speculative enthusiasm. Glassnode analysts note that Open Interest drops of over 15% frequently precede consolidation phases lasting several weeks.

Despite the current slowdown in derivatives activity, XRP’s long-term outlook remains underpinned by ongoing ripple ecosystem advancements, including cross-border payment integrations. Traders should watch for rebounds in Open Interest as a potential signal of renewed market confidence and possible whale accumulation resuming.

### The Role of Liquidation Zones in XRP’s Price Volatility

Liquidation zones are pivotal in shaping XRP’s current price risks. Coinglass heatmaps highlight concentrated liquidation clusters around $2.30 and $2.20, where more than $100 million in leveraged positions could be liquidated.

These zones act as magnets for price action—breaching them can trigger cascading forced liquidations, potentially amplifying price swings. For example:

– A breakdown below $2.20 may initiate a chain reaction of sell-offs.
– Holding above $2.20 could prompt short-covering, leading to a relief rally.

Binance futures data supports this vulnerability, showing a 20% spike in 24-hour liquidation volumes in recent sessions.

CryptoQuant analysts emphasize the influence of such liquidity pockets on short-term price direction, advising leveraged traders to exercise caution. Recent price tests near the upper boundary of this range confirm the need for sustained trading volume to validate a bullish reversal.

### Frequently Asked Questions

**What factors are contributing to XRP whale selling pressure in 2025?**

XRP whale selling pressure is primarily driven by profit-taking following recent gains, coupled with macroeconomic uncertainties and ongoing regulatory developments surrounding Ripple’s legal challenges. Over five days, approximately 900,000 XRP tokens were distributed, increasing market supply and exerting downward price pressure. While this intensifies short-term bearish risks, it does not diminish XRP’s long-term utility in cross-border payments.

**Will XRP hold the $2.20 support level amid current volatility?**

The $2.20 support is a critical technical level for XRP, historically acting as a strong floor during corrections. Current technical readings—including an RSI near oversold and consolidation within a key demand zone—suggest bulls could defend this level if accompanied by an uptick in volume. However, failure to hold $2.20 may expose lower support zones around $2.00, emphasizing the need for traders to prepare for potential volatility.

### Key Takeaways

– **Whale Offloads Signal Caution:** The sell-off of 900,000 XRP tokens by large holders has increased bearish sentiment, pressing prices toward crucial support levels.
– **Open Interest Contraction:** A 15.73% drop to $3.52 billion reflects reduced leverage in the market, which may stabilize prices but limit short-term upside momentum.
– **Liquidation Zones at the Forefront:** Traders should focus on the $2.20–$2.30 range as key zones for price volatility and potential directional shifts.

### Conclusion

XRP’s current market environment is characterized by intensified whale selling pressure, declining Open Interest, and concentrated liquidation clusters, fostering cautious trading sentiment. Prices are testing a vital demand zone between $2.20 and $2.30, with bearish technicals dominating. However, oversold signals do provide some hope for a rebound if buyers mount strong defenses.

As the Ripple network continues to expand its real-world applications, investors should closely monitor on-chain metrics and technical signals. Staying informed and prepared can offer strategic advantages in navigating this evolving landscape.
https://bitcoinethereumnews.com/tech/xrp-whale-sell-off-signals-potential-downside-near-2-2-support-zone/

DTCC Lists Nine XRP ETFs as Countdown to Potential Launch Begins

The Depository Trust & Clearing Corporation (DTCC) has recently listed nine XRP ETFs on its platform, signaling potential new trading opportunities for investors. These nine products include a mix of spot-based and futures-based strategies, filed between October 2024 and June 2025. The listings suggest that several XRP ETFs could begin trading as early as November 13, pending final regulatory approval.

### What Does a DTCC Listing Mean?

When an ETF appears on the DTCC site, it means the fund has completed initial registration steps and is prepared for market settlement once regulatory approval is granted. However, it’s important to note that a DTCC listing does not confirm that trading has already started.

### Futures-Based XRP ETFs Already Trading

Currently, four XRP ETFs that utilize futures contracts to track the token’s price movements are actively trading in the market. Examples include the ProRP ETF. These futures-based funds offer daily leverage ranging from one to two times the price movement of XRP. Instead of holding actual XRP tokens, these ETFs gain exposure through derivatives contracts.

In addition, the REX-Osprey XRP ETF, launched in September, operates as a hybrid product with approximately 80% spot exposure. This fund functions under the regulatory framework of the 1940 Act, allowing it to trade while pure spot XRP ETFs await final SEC approval.

### Spot-Based XRP ETFs Awaiting SEC Approval

Five XRP ETFs focusing on direct spot exposure—meaning they hold actual XRP tokens—are still under review by the Securities and Exchange Commission (SEC). Among these is the spot component of the 21-Osprey ETF. Progress on these applications stalled following the U.S. government shutdown on October 1, which delayed the review of more than 16 altcoin ETF filings, including those involving XRP, Solana, Dogecoin, and Cardano.

### Renewed Optimism for Spot XRP ETFs

Recent developments have boosted optimism for the approval of spot XRP ETFs. Canary Capital has removed a delaying amendment from its filing, setting an automatic effective date of November 13, pending the Nasdaq’s clearance of the ticker symbol.

Both Fidelity and Canary Capital have filed final S-1 updates for their altcoin ETF applications, aligning with this same November 13 target date. If the SEC approves these submissions, several spot XRP ETFs are expected to start trading on or around that date.

### Broader Progress in the Altcoin ETF Market

Despite earlier delays, the altcoin ETF market has seen notable progress recently. On October 28, Canary Capital launched the first U.S. spot Litecoin ETF, while Bitwise rolled out its spot Solana ETF under new generic listing standards on the same day. Grayscale’s Solana ETF followed with a launch on October 29.

These developments demonstrate that the SEC has resumed processing applications for altcoin ETFs, signaling potential momentum for the approval of XRP ETFs and other pending cryptocurrency products before the end of November.

Investors interested in XRP ETFs should keep an eye on regulatory updates and market announcements as November 13 approaches, which could mark a significant expansion in options for crypto-based exchange-traded funds.
https://coincentral.com/dtcc-lists-nine-xrp-etfs-as-countdown-to-potential-launch-begins/

SOL Price Plunges to $158 as BSOL ETF Fails to Spark Rally

**Solana Price Crashes to $158 Following Breakdown from Symmetrical Triangle Pattern**

Solana (SOL) has experienced a sharp price decline, dropping to $158 after breaking down from a critical symmetrical triangle pattern that traders had closely monitored. This breakdown marked a clear shift in market momentum following weeks of consolidation and typically signals the start of a strong directional move.

The price fell below a crucial support zone between $178 and $180, a level that combined horizontal support with the 0.382 Fibonacci retracement and the 21 exponential moving average (EMA). This breach led to the formation of a lower low at $158, confirming strong bearish momentum.

### Technical Indicators Signal Mixed Outlook

Technical analysis presents a mixed picture for Solana’s next move. The Bollinger Band Width Percentile spiked on the four-hour chart, indicating heightened volatility. However, the daily reading stands at 65%, suggesting room for further price movement as the market searches for direction.

### Bitwise’s BSOL ETF Launch Drives Market Attention

On October 28, Bitwise introduced its BSOL ETF, a staking-enabled investment product for Solana. The fund gained significant traction, accumulating $400 million in assets under management within its first week—a figure surpassing Rex-Osprey’s SSK ETF, which holds $370 million.

Despite this strong interest in the BSOL ETF, the fund launch did not prevent the steep price decline in SOL. Market participants remain watchful, anticipating whether continued fund inflows might offer the buying pressure necessary to reverse the downtrend.

### Solana Tests Critical Support Zone Between $155 and $165

Currently, Solana’s price is testing an important historical demand zone between $155 and $165. This area has previously attracted strong buying interest during corrective phases and is now under scrutiny as traders evaluate whether accumulation will occur.

The $155 level represents the next significant support. If this zone fails to hold, Solana’s price could extend losses toward the $130 to $140 range — levels that mark deeper retracements from recent rallies.

### Market Outlook and Potential Recovery Catalysts

Volatility indicators hint that the market may be approaching an exhaustion point, potentially setting the stage for a short-term relief bounce as momentum indicators reach extreme values. However, daily timeframe signals suggest there is still room for further movement.

A key factor in any potential recovery will be continued inflows into the BSOL ETF. If institutional interest and fund flows increase, these could provide critical buying pressure to stabilize or even lift Solana’s price.

For now, market structure and sentiment hinge on whether the current support levels near $155 hold firm, determining if Solana will rebound or face continued declines.

*Stay tuned for further updates on Solana’s price action and market developments.*
https://coincentral.com/sol-price-plunges-to-158-as-bsol-etf-fails-to-spark-rally/

Bitcoin’s November sell-off worsens as investors take risk off on worries about the AI trade

Bitcoin fell victim to a risk-off mood on Tuesday, as investors dumped the cryptocurrency amid growing concerns about the sustainability of AI stock values.

Bitcoin was last trading at $103,952, down 2.5% on the day and around 6% over the past two days. Ether, the second-largest cryptocurrency by market capitalization, also saw declines, shedding 2.5% on Tuesday and losing more than 10% over two days to trade at $3,503.

Although Bitcoin’s safe-haven status has strengthened recently, the token shares many of the same large investors as artificial intelligence stocks. This overlap links the two trades, causing both to decline when one falters.

Nasdaq futures were down 1.5% on Tuesday, with investors selling AI-linked Palantir amid concerns about its sky-high valuation, despite the company posting solid earnings results.

Compass Point analyst Ed Engel also noted that retail investors may not be buying the dip as actively as before. “While selling from long-term holders is a common feature in bull markets, retail spot buyers have been less engaged than prior cycles,” he said in a note.
https://www.cnbc.com/2025/11/04/bitcoins-november-sell-off-worsens-as-investors-take-risk-off-on-worries-about-the-ai-trade-.html

Exit mobile version
Sitemap Index